Clinical Usage of Growth Charts
The selection of a growth chart relies on the child's age and the specific monitoring goals established by health authorities. In the United States, current guidelines recommend WHO growth standards for infants aged 0 to 2 years to track growth against an optimal health model. The CDC growth reference is applied to children aged 2 to 20 years to compare individual growth against historical national averages.
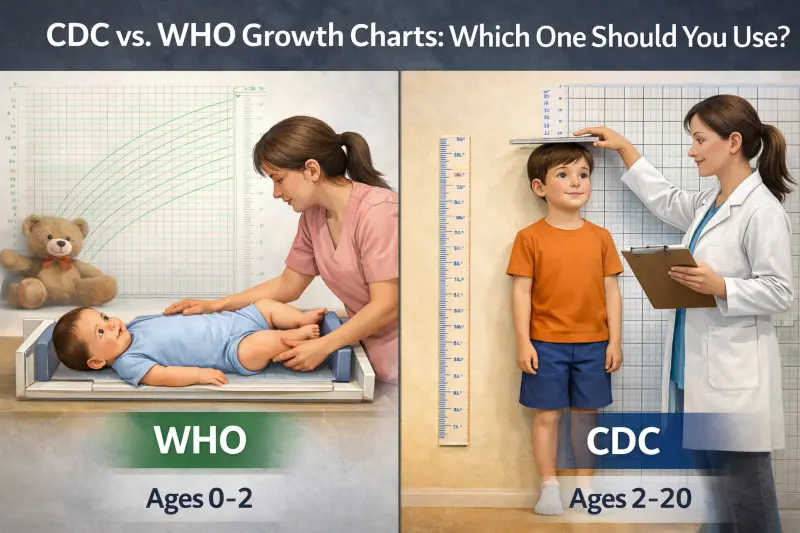
Visual comparison of WHO and CDC growth chart standards showing key differences in measurement approaches.
Table of Contents
Want to see your child's current percentile?
Our percentile calculator uses the appropriate growth charts based on your child's age - WHO standards for 0-2 years and CDC reference for 2-20 years.
Calculate Your Child's PercentileMedical professionals use growth charts to visualize a child's physical development over time relative to a standardized population. During routine well-child visits, pediatricians, nurses, and dietitians plot specific measurements on these grids. Parents can also track their child's growth using tools like our Child Height Calculator, which applies the appropriate growth charts based on the child's age.
Standard Measurements Tracked
Growth charts track specific physical measurements over time. Accurate measurement technique is crucial for reliable results - learn proper measurement methods to ensure precise tracking.
- Weight: Total body mass measured in pounds or kilograms
- Length (or stature): Height measurement from head to toe
- Head circumference: Measurement around the largest part of the head (typically for infants and toddlers)
These plots create a visual trajectory that helps clinicians screen for potential health or nutritional deviations.
Understanding Percentile Rankings
The resulting percentile ranking indicates the percentage of children in the reference group who weigh less or measure shorter than the patient. The ranking provides statistical context. For example, if you use our Child Height Calculator and your child falls in the 75th percentile, this means they are taller than 75% of children their age.
Example: Understanding the 75th Percentile
A child in the 75th percentile for weight weighs more than 75% of the reference population. This number situates the child's size at a specific moment in time relative to peers.
Interpretation of Growth Patterns
A single measurement point provides limited clinical value on its own. Clinicians assess the consistency of the growth curve over multiple visits rather than focusing on a specific percentile number. Parents can track these patterns using our Child Height & Weight Percentile Calculator to monitor their child's growth trajectory over time.
| Pattern Type | Description | Clinical Significance |
|---|---|---|
| Stability | Staying along a consistent curve | Generally considered a marker of steady growth |
| Deviation | Crossing two major percentile lines | Typically triggers further clinical assessment |
When to Seek Medical Evaluation
Significant shifts, such as dropping from the 75th to the 25th percentile over time, warrant professional assessment to rule out underlying health or nutritional issues.
Methodology and Data Sources
WHO Growth Standards (0–5 Years)
The World Health Organization (WHO) released its growth standards in 2006 based on the Multicenter Growth Reference Study (MGRS). This study collected primary data from approximately 8,500 children across six countries: Brazil, Ghana, India, Norway, Oman, and the United States. The methodology prioritized a prescriptive approach to data collection.
WHO Inclusion Criteria
The study specifically selected children raised in environments believed to support optimal growth to create a "standard" rather than a "reference."
- Population: Exclusively or predominantly breastfed for at least 4 months.
- Environment: Non-smoking households with access to healthcare and nutrition.
- Concept: These charts define how children should grow under ideal conditions.
CDC Growth Reference (2–20 Years)
The Centers for Disease Control and Prevention (CDC) released the 2000 growth charts based on data from five national health examination surveys (NHANES) conducted between 1963 and 1994. These charts represent the growth of children in the United States during that specific 30-year period using a descriptive approach.
CDC Data Composition
The CDC charts reflect a cross-section of the population as it existed during the survey years.
- Population: A mix of breastfed and formula-fed infants (approximately 50% formula-fed).
- Demographics: Represents the general U.S. population at the time, including various health statuses.
- Concept: These charts describe how children grew at a specific time and place.
CDC Clinical Growth Charts
Birth to 36 Months: 5th and 95th Percentiles
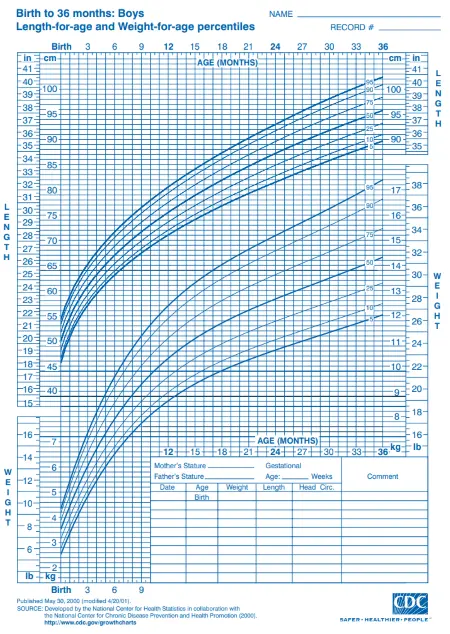
Boys (Birth to 36 months)
Length-for-age and Weight-for-age percentiles (5th and 95th percentiles)
Download PDF Chart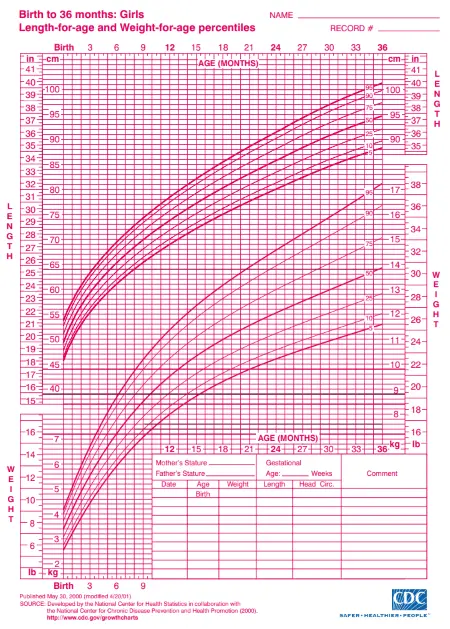
Girls (Birth to 36 months)
Length-for-age and Weight-for-age percentiles (5th and 95th percentiles)
Download PDF ChartBirth to 36 Months: 3rd and 97th Percentiles
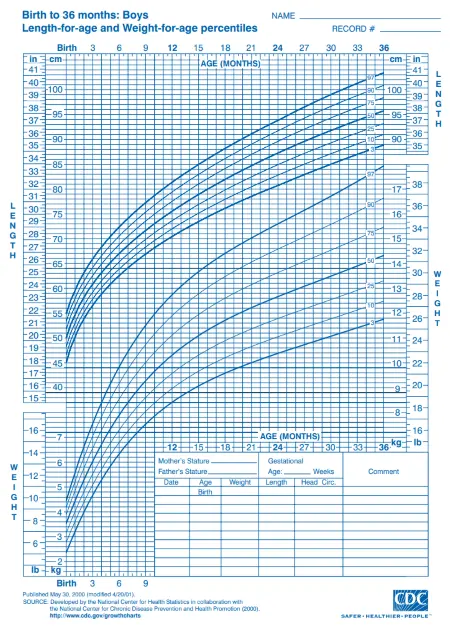
Boys (Birth to 36 months)
Length-for-age and Weight-for-age percentiles (3rd and 97th percentiles)
Download PDF Chart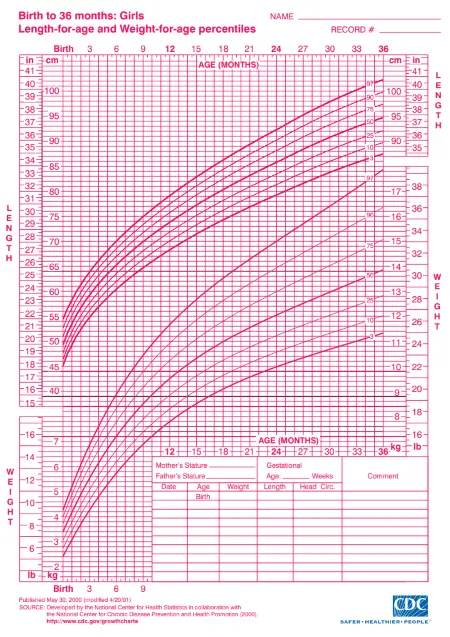
Girls (Birth to 36 months)
Length-for-age and Weight-for-age percentiles (3rd and 97th percentiles)
Download PDF Chart2 to 20 Years: 5th and 95th Percentiles
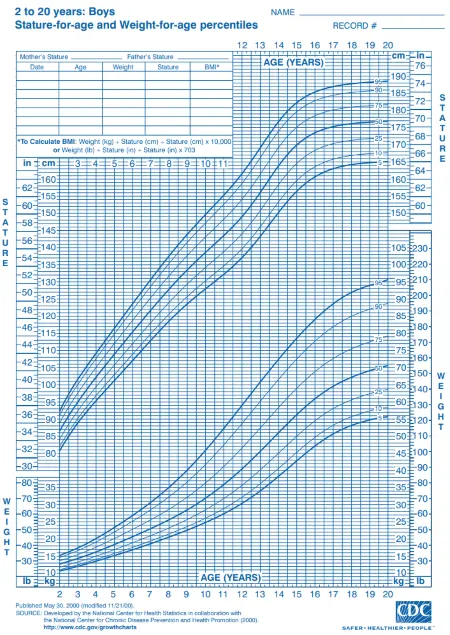
Boys (2 to 20 years)
Stature-for-age and Weight-for-age percentiles (5th and 95th percentiles)
Download PDF Chart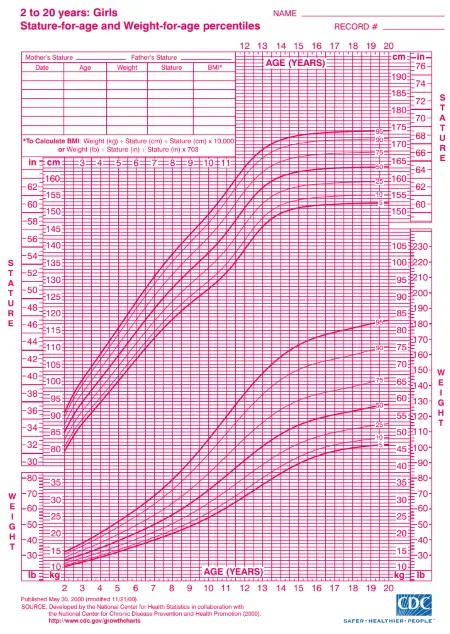
Girls (2 to 20 years)
Stature-for-age and Weight-for-age percentiles (5th and 95th percentiles)
Download PDF Chart2 to 20 Years: 3rd and 97th Percentiles
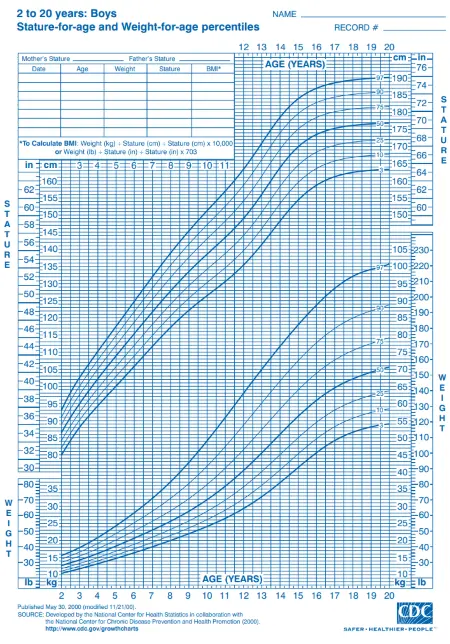
Boys (2 to 20 years)
Stature-for-age and Weight-for-age percentiles (3rd and 97th percentiles)
Download PDF Chart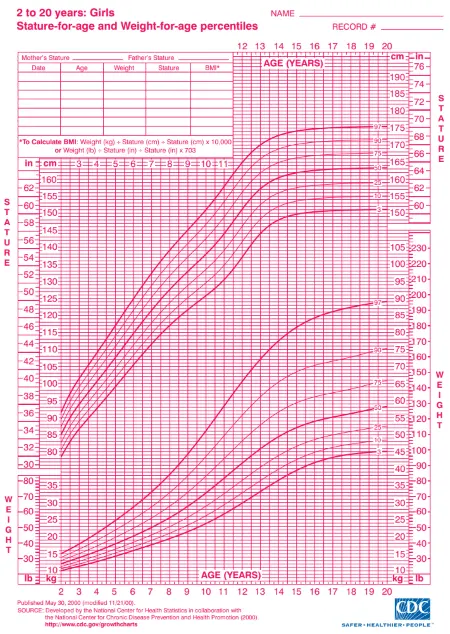
Girls (2 to 20 years)
Stature-for-age and Weight-for-age percentiles (3rd and 97th percentiles)
Download PDF ChartNote: These CDC clinical charts cover the full age range from birth to 20 years. The birth to 36 months charts use "length" measurements (recumbent), while 2-20 year charts use "stature" measurements (standing). The 5th/95th percentile charts are most commonly used in clinical practice, while the 3rd/97th percentile charts provide extended range for identifying more extreme growth patterns. For infants 0-2 years, WHO growth standards are recommended over CDC charts.
Key Differences and Similarities
Age-Based Recommendations
The primary distinction in clinical practice involves the age of the child. Since 2010, the CDC and the American Academy of Pediatrics recommend the WHO standards for children under 2 years of age.
Clinical Consensus on Feeding Methods
This recommendation aligns with the clinical consensus that breastfeeding leads to different growth trajectories than formula feeding.
For children aged 2 years and older, the CDC reference charts serve as the standard monitoring tool in the U.S.
Impact of Feeding Method on Curves
The growth trajectory of breastfed infants differs distinctively from that of formula-fed infants. The data reveals distinct patterns:
WHO Charts (Breastfed Base):
Typically show faster weight gain in the first 3 months of life, followed by slower weight gain compared to CDC charts.
CDC Charts (Mixed Base):
Include formula-fed infants who tend to gain weight more steadily later in infancy.
Clinical Implication:
A healthy breastfed infant plotted on a CDC chart might appear to be gaining weight too slowly after 3 months, while the WHO charts characterize this pattern as normal.
Statistical Comparison of Methodologies
The following table outlines the structural differences between the two measurement systems.
| Feature | WHO Growth Standards | CDC Growth Reference |
|---|---|---|
| Rec. Age (US) | 0 – 2 years | 2 – 20 years |
| Data Origin | Longitudinal (0-24 mo) & Cross-sectional (18-71 mo) | National surveys (NHANES) 1963–1994 |
| Feeding Base | 100% Breastfed (prescriptive) | ~50% Formula / 50% Breastfed (descriptive) |
| Global Reach | 6 Countries (International) | United States only |
| Primary Goal | Define optimal growth (Standard) | Describe typical growth (Reference) |
Hypothetical Plotting Scenario
Sample Measurement
This scenario demonstrates how the same physical measurement can result in different statistical classifications depending on the chart used. Our Child Height Calculator automatically selects the appropriate chart system based on your child's age to ensure accurate interpretation.
Subject Profile:
- Subject: 12-month-old female
- Weight: 9.0 kg (19.8 lbs)
- Health Status: Healthy, meeting developmental milestones
Interpretation Variance
When this single data point is plotted on the two different charts, the percentile output shifts due to the underlying reference populations.
WHO Chart Plotting:
On the WHO weight-for-age chart, 9.0 kg typically falls near the 50th percentile.
This indicates the child is right in the middle of the "optimal" growth range for breastfed infants.
CDC Chart Plotting:
On the CDC weight-for-age chart (based on heavier formula-fed averages), 9.0 kg may fall closer to the 25th-30th percentile.
This suggests the child is below average compared to the mixed feeding reference population.
Key Observation:
While the child's weight is identical, the CDC chart implies she is smaller relative to the reference group than the WHO chart does.
Using the WHO chart avoids the potential misinterpretation that the child is underweight.
Clinical Impact Summary
Same Child, Different Interpretation:
- • WHO: "Normal, healthy growth pattern"
- • CDC: "Below average, monitor closely"
Why This Matters:
- • Prevents unnecessary parental anxiety
- • Avoids inappropriate interventions
- • Supports breastfeeding confidence
Known Data Limitations
Limitations of WHO Standards
The WHO standards have specific exclusion criteria that impact their application to certain populations.
Preterm Infants:
The MGRS study excluded infants born before 37 weeks and those with low birth weight. Specialized charts (such as Fenton) are often required for correct preterm assessment.
Data Collection:
While global, the sample size per country was relatively small compared to national census data.
Limitations of CDC Reference
The CDC data reflects a historical population that may not match current demographics perfectly.
Outdated Reference:
The data originates from 1963–1994, meaning it does not reflect the recent increase in childhood obesity.
Feeding Mix:
The inclusion of formula-fed infants makes it less sensitive to the natural growth patterns of exclusively breastfed babies, potentially masking excessive weight gain in early infancy.
Clinical Considerations
Understanding these limitations helps healthcare providers make informed decisions about which charts to use and when additional specialized tools may be necessary.
WHO Chart Considerations:
- • Not suitable for preterm infants
- • Limited sample size per country
- • Optimal growth model may not reflect all populations
CDC Chart Considerations:
- • Based on historical data (1963-1994)
- • May not reflect current obesity trends
- • Mixed feeding base affects breastfed interpretation
Reference Tables
Available Charts and Variables
Both organizations provide specific charts for different variables. The selection of the correct chart depends on the metric being analyzed and the precision required.
| Variable | WHO Charts (0-2 Years) | CDC Charts (2-20 Years) |
|---|---|---|
| Weight | Weight-for-age | Weight-for-age |
| Length/Height | Length-for-age (Recumbent) | Stature-for-age (Standing) |
| Body Mass | Weight-for-length | BMI-for-age |
| Head Size | Head circumference-for-age | Head circumference-for-age |
WHO Chart Selection (0-2 Years)
- • Weight-for-age: Primary screening tool for underweight
- • Length-for-age: Measures linear growth and stunting
- • Weight-for-length: Assesses wasting and overweight
- • Head circumference: Monitors brain development
CDC Chart Selection (2-20 Years)
- • Weight-for-age: Used primarily for children 2-10 years
- • Stature-for-age: Tracks height development over time
- • BMI-for-age: Standard for assessing weight status in children
- • Head circumference: Less commonly used after age 3
Key Measurement Differences
Length vs. Stature:
WHO uses "length" (recumbent measurement) for infants, while CDC uses "stature" (standing measurement) for older children.
Weight-for-Length vs. BMI:
WHO uses weight-for-length ratios for infants, while CDC transitions to BMI-for-age calculations for children 2 years and older. Understanding how child BMI differs from adult BMI is essential for proper interpretation.
Age Transition:
The transition from WHO to CDC charts at age 2 requires careful consideration of measurement methodology changes.
Population Demographics
The demographic makeup of the data sources dictates applicability.
| Standard | Population Details |
|---|---|
| WHO | Healthy, breastfed children from favorable socioeconomic backgrounds in 6 diverse nations. Excludes preterm or low birth weight infants. |
| CDC | U.S. children from diverse backgrounds, including those with suboptimal health or nutrition. Includes both breastfed and formula-fed infants. |
WHO Population Characteristics
Geographic Diversity:
Brazil, Ghana, India, Norway, Oman, and the United States
Health Status:
Optimal health conditions with access to healthcare
Feeding Method:
Exclusively or predominantly breastfed for at least 4 months
Exclusions:
Preterm births, low birth weight, smoking households
CDC Population Characteristics
Geographic Scope:
United States national population sample
Health Status:
Representative sample including various health conditions
Feeding Method:
Mixed population (~50% formula-fed, 50% breastfed)
Inclusions:
Broad demographic representation of U.S. children
Clinical Implications
Prescriptive vs. Descriptive:
WHO charts show how children should grow under optimal conditions, while CDC charts show how children typically grew in the U.S. population.
Population Applicability:
WHO standards may be more appropriate for healthy, breastfed infants, while CDC references reflect the broader U.S. population reality.
Socioeconomic Considerations:
The WHO population's favorable socioeconomic conditions may not reflect all clinical populations, requiring careful interpretation.
Summary: Which Chart Should You Choose?
Final Verdict
The decision is driven strictly by the child's age and the need for continuous health monitoring. Tools like our Child Height Calculator simplify this process by automatically applying the correct growth standards based on your child's age.
Comparison Snapshot
| Feature | WHO (0–2 Years) | CDC (2–20 Years) |
|---|---|---|
| Best For | Infants & Toddlers | School-Age & Teens |
| Base Model | Breastfed (Optimal) | Mixed Diet (Typical) |
| Key Advantage | Prevents over-feeding | Tracks long-term BMI |
FAQ
Why do WHO charts show a percentile drop for newborns in the first week?
WHO growth charts rely on aggregate data points and do not account for physiological neonatal weight loss. Most newborns lose between 5% and 10% of their birth weight in the first days of life due to fluid shifts. This is a normal physiological process, but the charts do not capture it perfectly for the following reasons:
Time Scale:
WHO standards plot growth over weeks and months rather than daily fluctuations.
Data Aggregation:
Plotting a 5-day-old infant's weight often results in a lower percentile than their birth percentile because the charts do not model this temporary dip.
Clinical Practice:
Physicians generally track the recovery of birth weight by 10–14 days rather than the initial drop on the curve.
Can a child switch between percentiles without it being a medical issue?
Yes, shifting percentiles is common and does not always indicate a health problem. Data indicates that growth is rarely linear. A study of nearly 10,000 children provided key insights into these fluctuations:
Frequency:
Two-thirds of children crossed at least one major percentile line in their first year.
Causes:
Fluctuations often occur during growth spurts, illness, or changes in diet.
Red Flags:
Healthcare providers look for sustained downward trends or crossing multiple percentile lines rapidly ("falling off the curve") rather than minor shifts.
Why does the CDC recommend WHO charts for US infants?
WHO charts better reflect the growth of breastfed infants, which is considered the biological norm. Using CDC charts for breastfed infants can result in misclassification for several reasons:
Formula Bias:
CDC charts include formula-fed babies who tend to be heavier later in infancy.
Misinterpretation:
A breastfed baby might appear underweight on a CDC chart when they are actually healthy.
Intervention Risk:
The WHO standards reduce the risk of unnecessary dietary interventions by using the breastfed infant as the control model.