What is the difference between Adult and Child BMI?
Adult BMI uses a static calculation (Weight/Height²) with fixed cutoff points for everyone. Child BMI (BMI-for-Age) uses the same calculation but interprets the result against a percentile growth chart based on age and gender. Because children's body fat changes naturally during growth, a "high" number for a child might actually be normal, whereas the same number for an adult would be underweight.
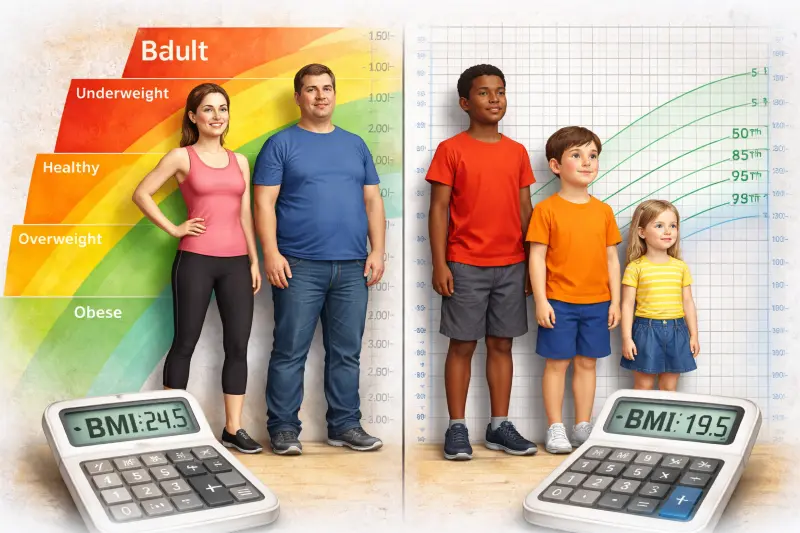
Visual comparison of adult BMI vs child BMI-for-age showing why the same formula produces different interpretations.
Table of Contents
The "Stocky" Phase Paradox: Why Active Kids Test "Obese"
Parents often panic when an active, healthy-looking child registers as "obese" on a standard calculator. This is a common real-world scenario.
- The Scenario: A child (e.g., 4 years old) is short but muscular from activity (hiking, swimming).
- The Data: Their height-to-weight ratio produces a high BMI number.
- The Reality: The child is not "fat"; they are dense. Muscle weighs more than fat by volume.
- The Outcome: Standard BMI calculators cannot distinguish between a child heavy with muscle and a child heavy with adipose tissue (fat).
When is BMI-for-Age Used?
Pediatricians use BMI-for-Age primarily as a screening tool, not a diagnostic one.
Trend Tracking
Watching a child cross percentiles rapidly (e.g., jumping from 50th to 85th).
Adiposity Rebound
Monitoring the natural increase in body mass that typically happens between ages 5 and 7.
Population Health
Classifying large groups of children for public health statistics.
Case Study: The "Hiker" vs. The Chart
Based on community data reports (4-year-old male subject)
| Metric | Value | Interpretation via Adult BMI | Interpretation via Child BMI |
|---|---|---|---|
| Height | 38 inches | Short | 10th Percentile |
| Weight | 38.5 lbs | Light | 50th-75th Percentile |
| Activity | High (Hiking) | N/A | High Muscle Mass |
| Result | High BMI | "Obese" | "False Positive" |
Analysis: Why Muscle Mass Skews Results
- The Conflict: The child has wide shoulders and muscular legs from hiking.
- The Error: An online calculator labeled him "obese."
- The Solution: The pediatrician reviewed the growth velocity (height increasing steadily) and physical build, determining the child was healthy. The BMI number was a "false alarm" caused by high muscle density.
Key Differences: Adult vs. Child BMI
Why the Math is the Same but the Meaning is Different
Both use the formula: Weight(kg)/Height(m)². However, the interpretation logic separates completely after the math is done.

Different growth stages require different BMI interpretation approaches as body composition changes naturally.
Comparison of Frameworks
| Feature | Adult BMI | Child BMI-for-Age |
|---|---|---|
| Variables | Height, Weight | Height, Weight, Age, Gender |
| Gender Rules | Same for Men/Women | Different charts for Boys/Girls |
| Cutoff Points | Fixed (e.g., 25.0 is Overweight) | Dynamic (e.g., 85th Percentile) |
| Fat Storage | Assumes static body fat | Accounts for "Baby Fat" & Puberty |
| Interpretation | Diagnostic | Screening Only |
Why Age Matters (The Physiology)
- Infants: High body fat is necessary for brain development.
- Preschoolers: Body fat drops (the "slimming out" phase).
- Teens:
- Girls: Gain body fat naturally during puberty.
- Boys: Gain muscle mass and lean tissue during puberty.
The Trap: Applying adult standards to a teen girl will falsely categorize natural puberty-related weight gain as "unhealthy."
The "Teen" Gray Area (Ages 15–19)
One of the most common errors is switching to an adult calculator too early.
- The Rule: You must use BMI-for-Age percentiles until the day the child turns 20.
- Why: A 16-year-old girl might have a BMI of 23. On an adult chart, this is "Normal." On a pediatric chart, depending on her exact age, it might be in the 85th percentile (Overweight).
- Puberty Impact: Teens experience rapid shifts in body composition. Girls typically gain necessary fat stores for hormonal health, while boys gain lean muscle. Adult calculators misinterpret these biological necessities as excess weight.
How to Calculate Child BMI (Formula & Example)
If you want to calculate the number manually before checking the chart, here is the formula.
Formula: Weight(kg) / [Height(m)]²
Example: A 10-year-old boy weighs 35 kg and is 1.4 meters tall.
Important: A BMI of 17.8 tells you nothing on its own. You must now find "17.8" on the BMI-for-Age Chart for a 10-year-old boy to see that he is in the 55th Percentile (Healthy Weight).
How to Interpret BMI-for-Age Categories
The Percentile System
The CDC classifies status based on where a child falls compared to peers using clinical growth charts with established weight status categories.
Underweight (<5th Percentile)
Less than the 5th percentile
Healthy Weight (5th–85th Percentile)
5th percentile to less than the 85th percentile
Overweight (85th–95th Percentile)
85th percentile to less than the 95th percentile
Obesity (>95th Percentile)
Equal to or greater than the 95th percentile
The "Severe Obesity" Classification
- Definition: BMI is ≥ 120% of the 95th percentile.
- Medical Codes: Doctors use ICD-10 codes (like Z68.54) to document this for insurance and treatment plans.
Common Issues & Solutions
Issue 1: The "Heavy" Athletic Child
Why: Muscle is 18% denser than fat.
Fix: Do not diet. Focus on the Waist-to-Height Ratio.
The Check: If the child's waist measurement is less than half their height, they likely carry healthy mass, regardless of BMI.
Issue 2: The Pre-Puberty "Chubby" Phase
Why: Children often gain weight horizontally before they shoot up vertically.
Fix: Wait and Watch. This is often a biological preparation for a growth spurt.
Action: Ensure activity remains high, but do not restrict calories if the child is hungry.
Issue 3: The "Constant Hunger"
Why: Rapid growth requires massive energy.
Fix: Protein and Fiber.
Action: Switch from "easy" calories (pouches, crackers) to "slow" calories (apples, meats, Greek yogurt). Fiber keeps them full longer.
Issue 4: "My Child looks skinny but has a low BMI"
Why: A child can be "skinny fat" (low muscle tone).
Fix: Increase Resistance Play.
Action: Climbing, monkey bars, and swimming build density.
Issue 5: Signs of "Failure to Thrive" (Underweight)
While much focus is on high BMI, dropping below the 5th percentile is a health risk.
What to look for: If a child's BMI percentile line crosses two major percentile lines downward (e.g., dropping from 50th to 10th).
Symptoms: Lack of energy, hair loss, or stopping vertical growth to preserve calories.
Medical Context: This is often not about "eating more" but could indicate absorption issues (like Celiac disease) or metabolic concerns. Accurate measurements are essential - learn how to measure your child's height correctly to ensure reliable tracking.
Real-World Solutions: The 5-2-1-0 Rule
The American Academy of Pediatrics recommends this simple daily framework to manage weight without obsessing over numbers.
Servings of fruits and vegetables
Hours or less of recreational screen time
Hour or more of physical activity
Sugary drinks (soda, juice)
Frequently Asked Questions
Is 120 pounds fat for a 12-year-old?
Direct Answer: It depends entirely on height.
- At 4'10" (147 cm): 120 lbs results in a BMI of ~25. This is likely in the 95th percentile (Obese).
- At 5'4" (162 cm): 120 lbs results in a BMI of ~20. This is in the 50th-75th percentile (Healthy/Average).
Solution: Use our Child Height Calculator to input the exact height for a valid answer.
Is a BMI of 15 bad?
Direct Answer: For a child, usually no. For an adult, yes.
- Age 6: A BMI of 15 is perfectly average (50th percentile).
- Age 16: A BMI of 15 is below the 1st percentile (Severely Underweight).
Context: You cannot judge the number 15 without the age variable.
Why don't doctors use BMI anymore?
Direct Answer: They do, but only as a rough screen. Many modern pediatricians prefer Growth Velocity (how fast is the child growing?) or Waist Circumference because BMI fails to account for muscle mass or genetic body types.
Is 100 lbs normal for a 12-year-old girl?
Direct Answer: Yes, it is very close to the median. For a 12-year-old girl of average height (approx. 59-60 inches), 100 lbs places her roughly in the 50th percentile for weight. This is the definition of "normal" or "average" in the US population.
What is the age range for pediatric BMI codes?
Direct Answer: Ages 2 to 20.
- 0-2 Years: Doctors measure Weight-for-Length (WHO standards).
- 2-20 Years: Doctors measure BMI-for-Age (CDC standards).
Is 90 pounds skinny for a 12-year-old?
Direct Answer: It is on the lower end, but may be healthy. If the child is average height, 90 lbs falls roughly around the 25th percentile. This means they are lighter than 75% of peers, but still well within the "Healthy Weight" zone (5th to 85th percentile).
Does age matter in a BMI calculator?
Direct Answer: Yes, it is the most critical variable. A 10-year-old and a 15-year-old can have the exact same height and weight, but totally different diagnosis categories. The 10-year-old might be "Overweight" while the 15-year-old is "Underweight" with the same stats.